
 |
|
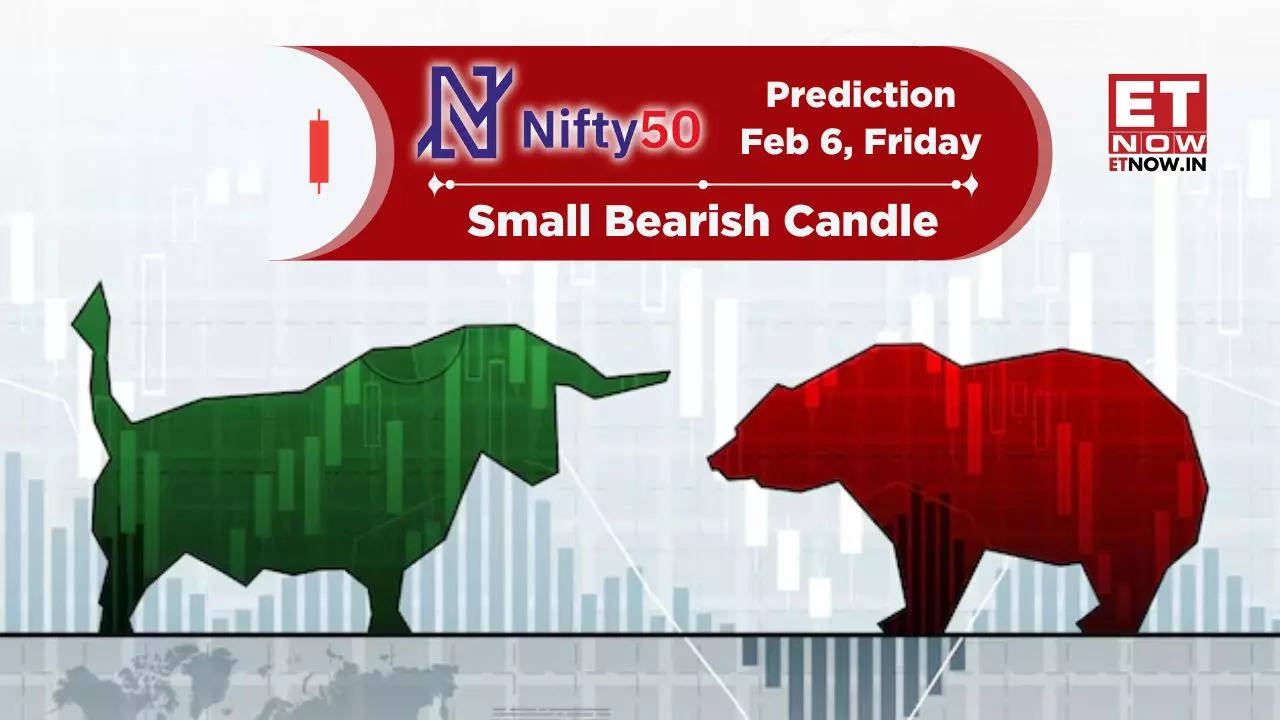
The Nifty 50 index experienced a minor decline on February 6th, 2025, closing at 23,603.35 after a 0.39% drop. This followed a similar trend on the previous day, with the benchmark indices reacting to the anticipation of the Reserve Bank of India's (RBI) monetary policy decision. Multiple market experts offered their predictions and analysis regarding the Nifty 50's performance for February 7th, highlighting key support and resistance levels. The consensus suggests a range-bound market with a relatively bullish short-term outlook, though the RBI's announcement holds significant sway over the overall market sentiment. The slight bearish candle on the daily chart, as noted by Rajesh Bhosale, indicates a potential continuation of this consolidation phase.
Rupak De of LKP Securities identified 23,500 as a crucial support level for the Nifty 50. He warned that breaking below this level could undermine bullish confidence and potentially lead to further declines. Conversely, he pointed to 23,800 and 24,050 as resistance levels. Devarsh Vakil of HDFC Securities offered a slightly more optimistic outlook, maintaining a short-term bullish sentiment despite the recent correction. He highlighted that the Nifty 50 remains above its 11 and 20-day exponential moving averages, suggesting underlying strength. He identified a break above 23,800 as a potential trigger for a rise towards the 24,050-24,100 resistance zone, while support is seen in the 23,400-23,450 range. These differing perspectives highlight the inherent uncertainty and volatility within the market, dependent on a multitude of factors beyond simple technical indicators.
Rajesh Bhosale of Angel One provided a detailed technical analysis, noting the small bearish candle on the daily chart and the approach towards a critical resistance zone. He identified the bullish gap near 23,400, aligned with the 20-day moving average (DMA), as crucial support. He also pinpointed various resistance levels at 23,800, 23,900 (89-day exponential moving average), 24,000 (200-day simple moving average), and 24,250 (previous swing high). His analysis emphasizes the importance of the 23,400-23,800 range as a key zone to monitor. This detailed technical breakdown is valuable for traders seeking to navigate the potential volatility, advising caution and potentially suggesting profit-booking at regular intervals until a strong buying trigger pushes the index through the identified resistance levels.
Om Mehra of SAMCO Securities provided a broader perspective, highlighting the overall positive trend on both daily and hourly charts, with the Nifty 50 holding above short-term moving averages. While acknowledging the index's consolidation within a defined range, he noted the daily RSI hovering near 55, suggesting a neutral-to-positive momentum. This reinforces the potential for continued consolidation, with support at 23,470. He also included Fibonacci retracement levels of 38.2% at 23,550 and 50% at 23,800, providing additional context for potential price movements. This analysis presents a balanced view, recognizing the positive primary trend but also cautioning for the potential for continued sideways movement in the short term. The consistent mention of support levels around 23,400-23,500 across multiple analysts underscores the importance of this level in determining future price action.
The confluence of these expert opinions paints a picture of a market poised for continued consolidation, with the immediate future heavily influenced by the RBI's monetary policy announcement. While the short-term trend shows some bullish signs, the potential for further declines below the 23,500 support level is a key risk factor. Traders and investors should carefully monitor these support and resistance levels, along with the RBI's decision and any significant news events that could impact market sentiment. The varying perspectives and detailed technical analyses highlight the complexity of predicting market movements with certainty, emphasizing the importance of risk management and diversified strategies.